demand: pie chart showing some data in the row during mouse hover
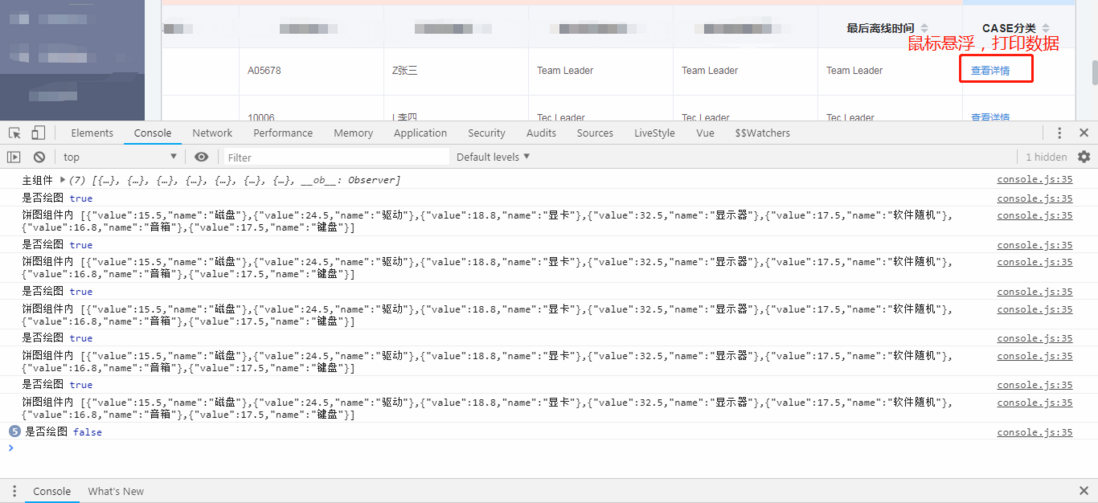
question 1. Each time the mouse hovers, it takes the pie chart data of the current row and passes it to the sub-component, but why does the sub-component print the data 5 times
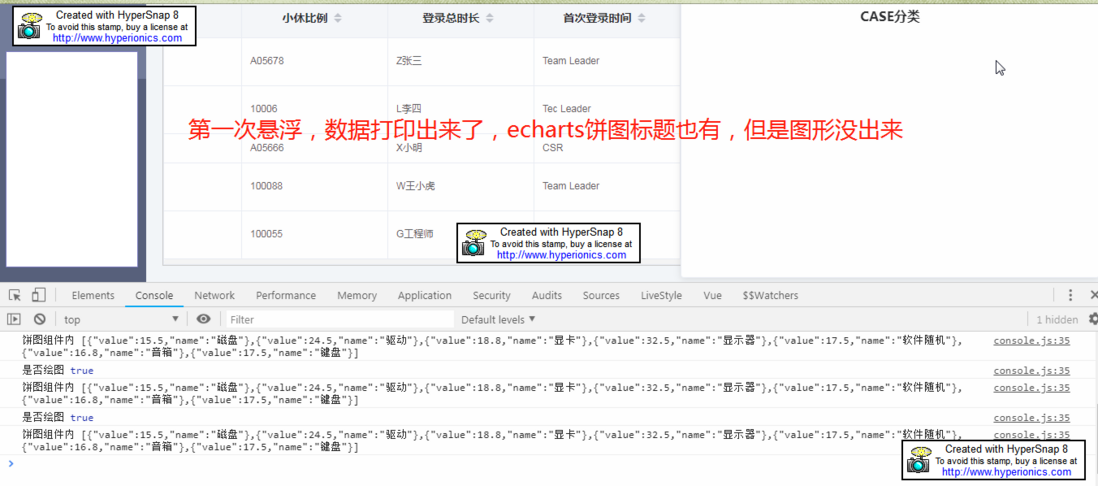
question 2. After the page is refreshed, the picture of the first mouse hover can not come out, the data is also printed in the sub-components, but the title of the pie chart comes out
figure 1: mouse hover "View details". After the main component prints out, it is only a set of data, while the sub-component prints
2:

tabular data
tableData: [{
    date: "A05678",
    name: "Z",
    address: "Team Leader",
    chartdata: [
      { value: 15.5, name: "" },
      { value: 24.5, name: "" },
      { value: 18.8, name: "" },
      { value: 32.5, name: "" },
      { value: 17.5, name: "" },
      { value: 16.8, name: "" },
      { value: 17.5, name: "" }
    ]
  }, {
    date: "10006",
    name: "L",
    address: "Tec Leader",
    chartdata: [
      { value: 10, name: "" },
      { value: 10, name: "" },
      { value: 10, name: "" },
      { value: 10, name: "" },
      { value: 10, name: "" },
      { value: 10, name: "" },
      { value: 40, name: "" }
    ]
  }, {
    date: "A05666",
    name: "X",
    address: "CSR",
    chartdata: [
      { value: 20, name: "" },
      { value: 20, name: "" },
      { value: 20, name: "" },
      { value: 10, name: "" },
      { value: 10, name: "" },
      { value: 10, name: "" },
      { value: 10, name: "" }
    ]
  }, {
    date: "100088",
    name: "W",
    address: "Team Leader",
    chartdata: [
      { value: 5, name: "" },
      { value: 5, name: "" },
      { value: 5, name: "" },
      { value: 5, name: "" },
      { value: 40, name: "" },
      { value: 20, name: "" },
      { value: 20, name: "" }
    ]
  }, {
    date: "100055",
    name: "G",
    address: "Tec Leader",
    chartdata: [
      { value: 17.5, name: "" },
      { value: 24.5, name: "" },
      { value: 18.8, name: "" },
      { value: 32.5, name: "" },
      { value: 17.5, name: "" },
      { value: 16.8, name: "" },
      { value: 15.5, name: "" }
    ]
  }],
parent component html
 <el-table-column  prop="date"  label="CASE"  sortable  width="140">
                  <template slot-scope="scope">
                    <el-popover trigger="hover" placement="bottom"
                    @show="showCurrentChart(scope.row)" @hide="hideCurrentChart(scope.row)">
                      <tbchart :chart-data="chartData" :draw-chart="drawChart"></tbchart>
                      <div slot="reference" class="name-wrapper">
                        <span style="color:-sharp3E8DDD"></span>
                      </div>
                    </el-popover>
                  </template>
                </el-table-column>
parent component method:
    showCurrentChart(currentRow) {
      this.chartData = []
      this.drawChart = true
      this.chartData = currentRow.chartdata
      console.log("", this.chartData)
    },
    hideCurrentChart(currentRow) {
      this.drawChart = false
      this.chartData = []
    }
Sub-component tbchart:
<template>
<!--  -->
  <div class="wrapper">
    <div id="myChart" :style="{width: "450px", height: "300px"}"></div>
  </div>
</template>

<script>
import echarts from "echarts"
require("echarts/theme/macarons")
export default {
  name: "tbchart",
  props: {
    chartData: {
      type: Array
    },
    drawChart: {
      type: Boolean
    }
  },
  data() {
    return {
    }
  },
  //   components: {
  //     addSolutions
  //   },
  watch: {
    drawChart(newVal, oldVal) {
      console.log("", newVal)
      if (newVal) {
        console.log("", JSON.stringify(this.chartData))
        this.drawLine(this.chartData)
      }
    }
  },
  mounted() {
    this.$nextTick(() => {
      console.log("", this.chartData)
      this.drawLine(this.chartData)
    })
  },
  destroyed() {
    console.log("")
  },
  methods: {
    drawLine(data) {
      const myChart = echarts.init(document.getElementById("myChart"), "macarons")
      myChart.setOption({
        title: {
          text: "CASE",
          subtext: "",
          textStyle: {//
            color: "-sharp303133",
            fontStyle: "normal",
            fontWeight: "bold",
            fontFamily: "sans-serif",
            fontSize: 16
          },
          x: "center"
        },
        center: ["55%", "60%"],
        tooltip: {
          trigger: "item",
          formatter: "{b} : {c}%"
        },
        // legend: {
        //   orient: "vertical",
        //   x: "left",
        //   data: ["1", "2", "3", "4", "5"]
        // },
        series: [
          {
            name: "CASE ",
            type: "pie",
            radius: ["30%", "60%"],
            center: ["55%", "55%"],
            avoidLabelOverlap: false,
            formatter: "{a|{a}}{abg|}\n{hr|}\n  {b|{b}:}{c}  {per|{d}%}  ",
            data: data,
            itemStyle: {
              normal: {
                label: {
                  show: true,
                  formatter: "{b} : {c}%"
                },
                labelLine: { show: true }
              }
            }
          }
        ]
      })
    }
  }
}
</script>

<style scoped rel="stylesheet/scss" lang="scss">
// @import "./common.scss";
.wrapper{
    padding:20px;
}
</style>

