How do echarts maps add custom coverings to the corresponding areas?

how do echarts maps add custom coverings to the corresponding areas?
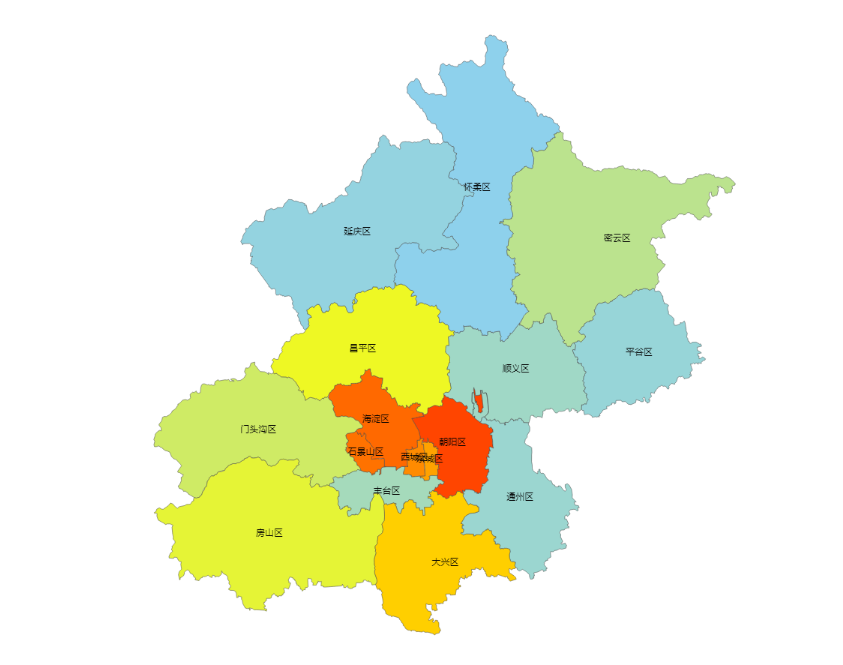
clipboard.png

for example, if you want to add a location icon and some text content to each area, how to achieve it?

related codes

<!DOCTYPE html>
<html lang="zh-CN">

<head>
    <meta charset="utf-8" />
    <meta http-equiv="X-UA-Compatible" content="IE=edge">
    <meta name="viewport" content="initial-scale=1.0, user-scalable=no" />
    <title></title>
    <link rel="stylesheet" type="text/css" href="css/normalize.css" />
    <link rel="stylesheet" href="css/pages.css">
    <script src="lib/jquery.min.js"></script>
    <script src="lib/echarts.min.js"></script>
    <!-- api -->
    <script type="text/javascript" src="http://api.map.baidu.com/api?v=2.0&ak=IRtuipZwpSnKGqnEYqXRLdlo247Vuzzr"></script>
    <!-- <script src="js/pages.js"></script> -->
</head>

<body>
    <div class="page_title"style="background-color: -sharp0075c7;">
        <h3 class="title">120</h3>
    </div>
    <div class="page_main site_main">
        <div class="mapContainer" id="mapContainer">

        </div>
    </div>
    <!--  -->
    <script>
        var dom = document.getElementById("mapContainer");
        var myChart = echarts.init(dom);
        var app = {};
        option = null;
        myChart.showLoading();

        $.get("data/bj.json", function (geoJson) {

            myChart.hideLoading();

            echarts.registerMap("CY", geoJson);

            myChart.setOption(option = {
                title: {
                    text: "",
                },
                tooltip: {
                    trigger: "item",
                    formatter: "{b}<br/>{c} (p / km2)"
                }, 
                visualMap: { //
                    min: 800,
                    max: 50000,
                    text: ["High", "Low"],
                    realtime: false,
                    calculable: true,
                    inRange: {
                        color: ["lightskyblue", "yellow", "orangered"]
                    }
                },
                series: [{
                    name: "18",
                    type: "map",
                    mapType: "CY", // 
                    itemStyle: {
                        normal: {
                            label: {
                                show: true
                            }
                        },
                        emphasis: {
                            label: {
                                show: true
                            }
                        }
                    },
                    data: [{
                            name: "", //
                            value: 20057.34 //
                        },
                        {
                            name: "",
                            value: 15477.48
                        },
                        {
                            name: "",
                            value: 31686.1
                        },
                        {
                            name: "",
                            value: 6992.6
                        },
                        {
                            name: "",
                            value: 44045.49
                        },
                        {
                            name: "",
                            value: 40689.64
                        },
                        {
                            name: "",
                            value: 37659.78
                        },
                        {
                            name: "",
                            value: 45180.97
                        },
                        {
                            name: "",
                            value: 55204.26
                        },
                        {
                            name: "",
                            value: 21900.9
                        },
                        {
                            name: "",
                            value: 4918.26
                        },
                        {
                            name: "",
                            value: 5881.84
                        },
                        {
                            name: "",
                            value: 4178.01
                        },
                        {
                            name: "",
                            value: 2227.92
                        },
                        {
                            name: "",
                            value: 2180.98
                        },
                        {
                            name: "",
                            value: 9172.94
                        },
                        {
                            name: "",
                            value: 3368
                        },

                    ],
                    // --
                    // nameMap: {
                    //     "Central and Western": "",
                    //     "Eastern": "",
                    //     "Islands": "",
                    //     "Kowloon City": "",
                    //     "Kwai Tsing": "",
                    //     "Kwun Tong": "",
                    //     "North": "",
                    //     "Sai Kung": "",
                    //     "Sha Tin": "",
                    //     "Sham Shui Po": "",
                    //     "Southern": "",
                    //     "Tai Po": "",
                    //     "Tsuen Wan": "",
                    //     "Tuen Mun": "",
                    //     "Wan Chai": "",
                    //     "Wong Tai Sin": "",
                    //     "Yau Tsim Mong": "",
                    //     "Yuen Long": ""
                    // }
                    markPoint:{ //
                        symbol:"pin",
                        symbolsymbolSize:100,
                    }
                }]
            });
        });;
        if (option && typeof option === "object") {
            myChart.setOption(option, true);
        }
    </script>
</body>

</html>

beginners have just touched the echarts map, obtained the geoJson data of Beijing from the Internet, and completed the display of the map block. Now they want to add a custom cover to display some content in each area. How can it be realized?

May.20,2022

configure another type graph with effectScatter in series to achieve the goal.
for more information, please see
effectScatter

.

Custom overlay

demo

MySQL Query : SELECT * FROM `codeshelper`.`v9_news` WHERE status=99 AND catid='6' ORDER BY rand() LIMIT 5
MySQL Error : Disk full (/tmp/#sql-temptable-64f5-1bf6244-31fb1.MAI); waiting for someone to free some space... (errno: 28 "No space left on device")
MySQL Errno : 1021
Message : Disk full (/tmp/#sql-temptable-64f5-1bf6244-31fb1.MAI); waiting for someone to free some space... (errno: 28 "No space left on device")
Need Help?