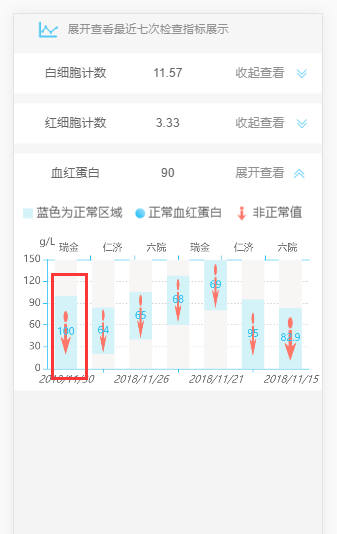
Why is it invalid to set the images size of backgroundColor to the label below series in echarts?

if the figure is the code for drawing echarts
myChart.setOption ({

)
            grid: {
                left: "3%",
                right: "4%",
                bottom: "3%",
                containLabel: true
            },
            xAxis: [
                {
                    type : "category",
                    splitLine: {show:false},
                    data : item.charts.date.map(function(str){
                        return str.replace("-","/")
                    }),
                    axisLine:{
                        lineStyle:{
                            color:"-sharp2EBFF4",
                        }
                    },
                    axisLabel: {
                        textStyle: {
                            color: "-sharp666",//
                            fontStyle:"italic"
                        }
                    },
                },
                {
                    type : "category",
                    splitLine: {show:false},
                    data :item.charts.yy,
                    axisLine:{
                        lineStyle:{
                            color:"-sharp2EBFF4",
                        }
                    },
                    axisLabel: {
                        textStyle: {
                            color: "-sharp666",//
                        }
                    },
                }
            ],
            yAxis: {
                name:"g/L",
                nameTextStyle:{
                    color:"-sharp666"
                },
                type : "value",
                //
                splitLine:{
                    show:true,
                    lineStyle:{
                        type:"dotted",
                        color:"-sharpD6D6D6"
                    }
                },
                //
                axisLine:{
                    lineStyle:{
                        color:"-sharp2EBFF4",
                    }
                },
                axisLabel: {
                    textStyle: {
                        color: "-sharp666",//

                    }
                },
            },
            stack: "component",
            xAxisIndex: 1,
            yAxisIndex: 1,
            itemStyle: {
                normal: {
                    color: "-sharpeee"
                }
            },
            series: [
                { // For shadow
                    type: "bar",
                    itemStyle: {
                        normal: {color: "-sharpF8F5F5"}
                    },
                    barGap:"-100%",
                    barCategoryGap:"40%",
                    data: dataShadow,
                    animation: false
                },
                {
                    name: "",
                    type: "bar",
                    stack:  "",
                    label:{
                        // backgroundColor:"-sharpD3F3F9"
                    },
                    itemStyle: {
                        normal: {
                            color: "-sharpF8F5F5"
                        },
                    },
                    barGap:"-100%",
                    barCategoryGap:"40%",
                    data: [0, 20, 40, 60, 80, 0]
                },
                {
                    name: "",
                    type: "bar",
                    stack: "",
                    label: {
                        normal: {
                            show: true,
                            position: "inside",
                            color:"-sharp2EBFF4",
                            verticalAlign: "middle",
                            // backgroundColor:{
                            //     image:images,
                            //     repeat:"norepeat",
                            //     width:0.5,
                            //     height:0.6
                            // },
                             lineHeight: 56,
                            rich: {
                                b: {
                                    backgroundColor: {
                                        image: images,
                                         height: 10
                                    },
                                    height: 10,
                                    lineHeight:10

                                },
                            }
                        }
                    },
                    itemStyle: {
                        normal: {
                            color: "-sharpD3F3F9"
                        },
                    },
                    data:data,
                }
            ]
        })

the effect picture is as follows. If you want to control the size of this background image, it is useless to set the configuration parameters given by echarts. Why, ask the gods for advice
clipboard.png

May.25,2022

original document: clipboard.png

{  
    height:10,  //
    backgroundColor: {
        image: images,
        height: 10  //
}

have you solved it? I have the same problem


The

problem has been solved. You can set it through the markPoint under series. The specific code is as follows. For more information, please see markPoint
echartsDrawxhdb (eRecience respare item) {

.
        var that = this
        var images 
        var upimg = this.upImg
        var myChart = this.$echarts.init(e)
        var data=item.charts.value
        var yMax
        if(Math.max.apply(null,item.charts.high)<Math.max.apply(null,item.charts.value)){
            //y
            
            if(Math.max.apply(null,item.charts.high)<1){
                yMax = Math.max.apply(null,item.charts.value)
            } else {
                yMax = Math.max.apply(null,item.charts.value)
            }
        } else {
            if(Math.max.apply(null,item.charts.high)<1){
                yMax = Math.max.apply(null,item.charts.high)
            } else {
                 yMax = Math.max.apply(null,item.charts.high)
            }
            
        }

        var dataShadow = [];
        var textColor 
        var markPoint = []
        var highData =[]
        var lowData = []
        item.charts.low.map(val=>{
            if(!val){
                Math.min.apply(null,item.charts.value)
            }
        })
        // -
        item.charts.high.forEach((val,index)=>{
            var value = val-item.charts.low[index]
            highData = highData.concat(value)
        })
        for (var i = 0; i < data.length; iPP) {
            dataShadow.push(yMax);
        }
        //markpoint
        item.charts.value.forEach((val,index)=>{
            var obj={
                label:{}
            }
            var size 
            if(item.charts.isNormal[index] == 3){
                //
                images = this.upImg
                textColor = '-sharpFF7768'
                size = 15
            } else if(item.charts.isNormal[index] == 4){
                //
                images = this.fallImg
                textColor = '-sharpFF7768'
                size = 15
            } else if(item.charts.isNormal[index] == 1){
                //
                images = this.isNormal
                textColor = '-sharp2EBFF4'
                size = 10
            } else {
                images = this.wran
                textColor = '-sharp666'
                size = 10
            }
            obj.coord = [index,val]
            obj.symbol = 'image://'+images
            obj.label.color = textColor
            obj.symbolSize = size
            if(item.charts.isNormal[index] ==3 || item.charts.isNormal[index] ==4 || item.charts.isNormal[index] ==1){
                
            }
            markPoint.push(obj)
        })
        
        var labelOption = {
            normal: {
                show: true,
                rich: {
                    name: {
                        color:'-sharp666'
                    }
                }
            }
        };
        var option = {
            grid: {
                left: '3%',
                right: '4%',
                bottom: '3%',
                containLabel: true
            },
            xAxis: [
                {
                    type : 'category',
                    splitLine: {show:false},
                    data : item.charts.date.map(function(value){
                        return value.replace(/-/g,"/")
                    }),
                    axisLine:{
                        lineStyle:{
                            color:'-sharp666',
                        }
                    },
                    axisLabel: {
                        textStyle: {
                            color: '-sharp666',//
                            fontStyle:'italic'
                        }
                    },
                    formatter:function(params){
                    //function
                    }
                },
                {
                    type : 'category',
                    splitLine: {show:false},
                    data :item.charts.yy.map(function(val){
                        return val
                    }),
                    axisLine:{
                        lineStyle:{
                            color:'-sharp666',
                        }
                    },
                    axisLabel: {
                        textStyle: {
                            color: '-sharp666',//
                        },
                        interval:0
                    },
                }
            ],
            yAxis: {
                max:yMax,
                name:'g/L',
                nameGap: 25,
                nameTextStyle:{
                    color:'-sharp666'
                },
                type : 'value',
                //
                splitLine:{
                    show:true,
                    lineStyle:{
                        type:'dotted',
                        color:'-sharpD6D6D6'
                    }
                },
                //
                axisLine:{
                    lineStyle:{
                        color:'-sharp2EBFF4',
                    }
                },
                axisLabel: {
                    textStyle: {
                        color: '-sharp666',//

                    }
                },
            },
            stack: 'component',
            xAxisIndex: 1,
            yAxisIndex: 1,
            itemStyle: {
                normal: {
                    color: '-sharpeee'
                }
            },
            series: [
                { // For shadow
                    type: 'bar',
                    itemStyle: {
                        normal: {color: '-sharpF8F5F5'}
                    },
                   // barGap:'-100%',
                    barCategoryGap:'40%',
                    data: dataShadow,
                    animation: false
                },
                {
                    name: '',
                    type: 'bar',
                    stack:  '',
                    itemStyle: {
                        normal: {
                            color: '-sharpF8F5F5'
                        },
                    },
                    barGap:'-100%',
                    barCategoryGap:'40%',
                    data: item.charts.low
                },
                {
                    name: '',
                    type: 'bar',
                    stack: '',
                    markPoint: { // markLine 
                        // data: markPoint,
                        data:markPoint,
                        symbolSize:20,
                        label:{
                            show:true,
                            formatter:function(val){
                                return  val.data.coord[1]

                            },
                            position: [0,-30],
                            offset:[0,20]
                        }
                    },
                    itemStyle: {
                        normal: {
                            color: '-sharpD3F3F9'
                        },
                    },
                    data:highData,
                },
            ]
        }
        newline(option,5, 'xAxis')
        myChart.setOption(option,true)
        // myChart.on('click',function(params){
        //     that.showBox(params,item)
        // });
    },
The question of

is very strange. It is clearly stated in the document that when backgroundColor is set to a picture, the picture size can be controlled with width and height, but the width and height of the text block is still controlled by fontSize font size

.
MySQL Query : SELECT * FROM `codeshelper`.`v9_news` WHERE status=99 AND catid='6' ORDER BY rand() LIMIT 5
MySQL Error : Disk full (/tmp/#sql-temptable-64f5-1ea768b-1e51.MAI); waiting for someone to free some space... (errno: 28 "No space left on device")
MySQL Errno : 1021
Message : Disk full (/tmp/#sql-temptable-64f5-1ea768b-1e51.MAI); waiting for someone to free some space... (errno: 28 "No space left on device")
Need Help?