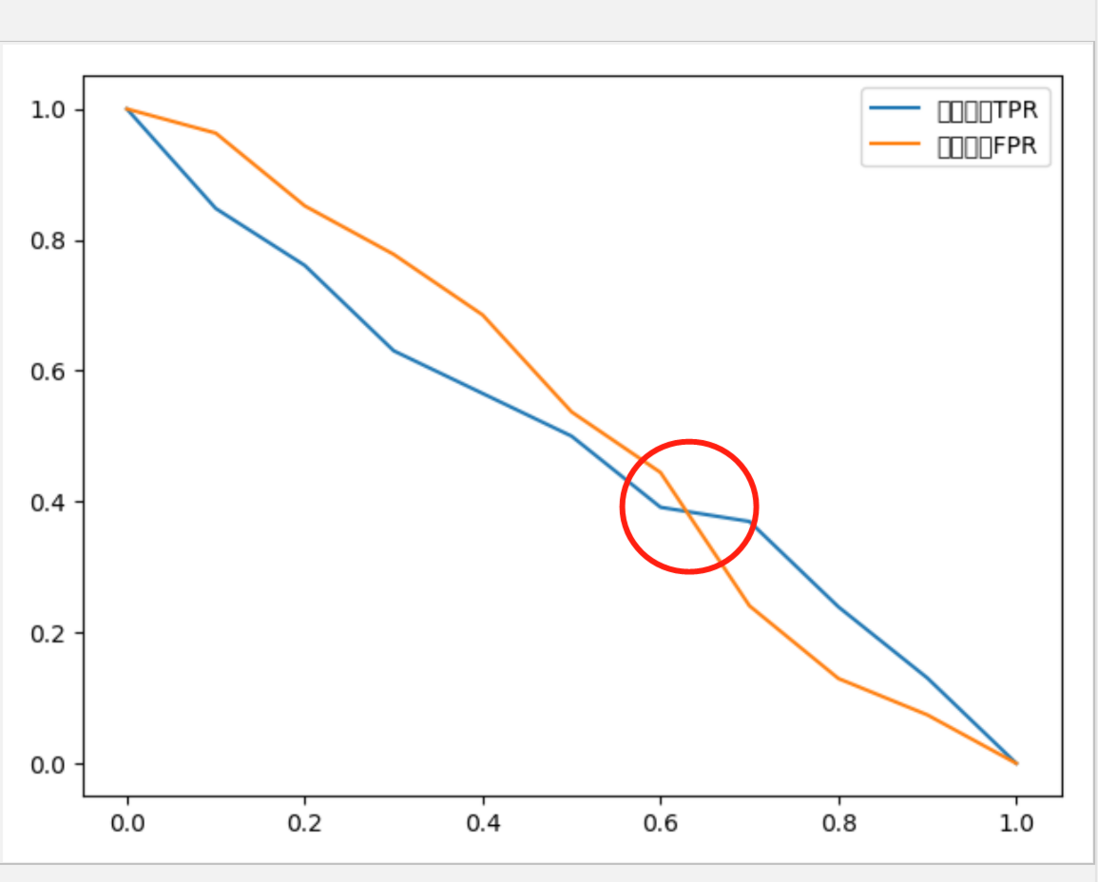
when I use the real case rate and false positive rate to calculate KS, I find that the two curves will cross, usually see that others do not cross, is my code wrong? Or is that how my data behaves?
this is my picture
)
from process.unsup_bin import AssignGroup
def cal_ks(rel_y,pre_y,is_plt):
    """
    :param rel_y:
    :param pre_y:
    :param cut_number:  0-1
    :return: AUC ks
    """
    bin = np.arange(0, 1.1, 0.1)
    -sharp0-1
    -sharp
    data = pd.DataFrame({"rel_y":rel_y,"pre_y":pre_y})
    -sharpsplit probabilt  accout to the cut point
    data["cut_point"] = data["pre_y"].map(lambda x: AssignGroup(x, bin))
    crossfreq = pd.crosstab(data["cut_point"], data["rel_y"] )
    god_ctn = crossfreq.sum()[0] -sharp
    bad_ctn = crossfreq.sum()[1]-sharp
    crossdens =pd.DataFrame()
    crossdens[1]= 1 - crossfreq[1].cumsum(axis=0)/bad_ctn -sharp
    crossdens[0] =1 -  crossfreq[0].cumsum(axis=0)/god_ctn  -sharp
    -sharp crossdens = 1- crossfreq.cumsum(axis=0) / crossfreq.sum()
    crossdens["gap"] = abs(crossdens[1] - crossdens[0])
    ks = crossdens[crossdens["gap"] == crossdens["gap"].max()]
    print([1] + crossdens[1].tolist())
    print( [1] + crossdens[1].tolist()+[0])
    print([0] + crossdens.index.tolist()+[1] )
    if is_plt ==1:
        plt.plot([0] + crossdens.index.tolist()+[1] , [1] + crossdens[1].tolist()+[0], label="TPR")
        plt.plot([0] + crossdens.index.tolist()+[1],  [1] + crossdens[0].tolist()+[0], label="FPR")
        -sharp
        plt.legend()
        -sharp
        plt.show()
    return ks,crossdens
