set directly
option={
 tooltip: {
        trigger: 'axis'
    },
}
reference: https://echarts.baidu.com/exa...
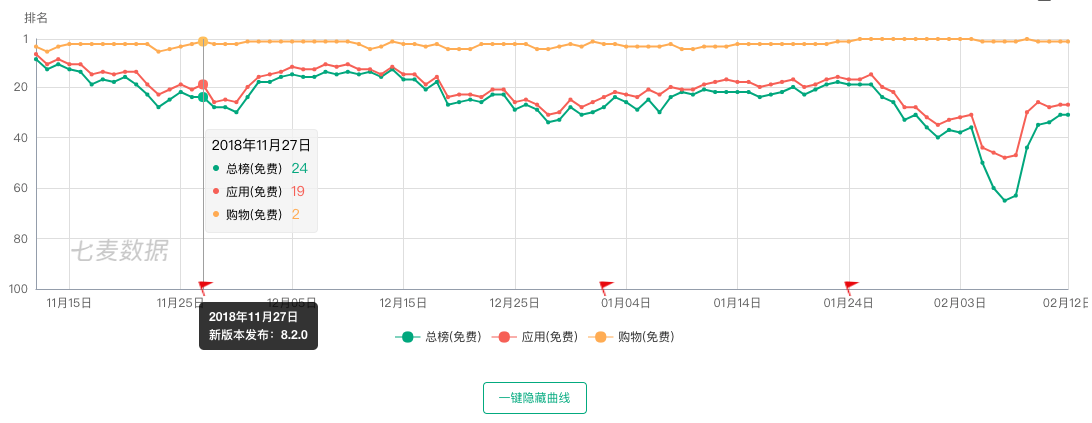
my idea is to get another series and set a separate tooltip for this series.
from the code snippet below, we can see that Qimai uses graphic to achieve this effect.
drawEcharts: function() {
var t = this,
e = this.chartData.data.version || [],
i = 1,
a = "YYYY\u5e74MM\u6708DD\u65e5",
o = "YYYY\u5e74MM\u6708DD\u65e5";
3600 == this.chartData.data.step ? (this.rankTypeShow = !1, this.chartData.data.total <= 24 ? (a = "HH\u70b9mm\u5206", o = "HH\u70b9") : (a = "YYYY\u5e74MM\u6708DD\u65e5HH\u70b9", o = "DD\u65e5HH\u70b9")) : (this.rankTypeShow = !0, i = 864e5, o = this.chartData.data.total >= 300 ? "YYYY\u5e74MM\u6708" : (this.chartData.data.total, "MM\u6708DD\u65e5"));
var r = [],
n = [];
[].forEach.call(this.chartData.data.list, function(t) {
n.push({
name: t.name
}), r.push({
type: "line",
name: t.name,
symbol: "circle",
data: t.data
})
});
var d = this.chartData.data.step,
p = this.chartData.data.total,
f = this.chartData.data.offline;
if (this.offlineTxtIsShow = !!f.length, f.length) {
var h = f,
u = [];
h.forEach(function(e) {
var i = (e.end - e.start) / 1e3 / d,
a = t.$refs.rankChartWrap.offsetWidth - 112,
o = a / p,
r = i * o > 160 ? "\u8be5\u65f6\u95f4\u6bb5\u5e94\u7528\u4e0b\u67b6" : "",
n = [];
n = [{
name: r,
xAxis: e.start,
itemStyle: {
normal: {
color: "rgba(216,216,216,0.35)"
}
}
}, {
xAxis: e.end
}], u.push(n)
}), r.push({
type: "line",
markArea: {
silent: !0,
label: {
normal: {
show: !0,
align: "center",
verticalAlign: "middle",
position: ["50%", "50%"],
color: "-sharp555"
}
},
data: u
}
})
}
if (this.seriesDataNum = r[0].data.length, this.echarts.clear(), this.echarts.setOption({
color: Object(l.c)(),
title: Object(l.e)(this.appinfo.subname + this.dayActiveObj.name + "\u6392\u540d\u8d8b\u52bf"),
tooltip: {
trigger: "axis",
confine: !0,
axisPointer: {
type: "line"
},
backgroundColor: "rgba(245, 245, 245, 0.8)",
borderWidth: 1,
borderColor: "-sharpeee",
textStyle: {
color: "-sharp000"
},
position: function(t, e, i, a, o) {
if (e.length) {
var r = {
top: 150
};
return r.left = t[0], r
}
},
formatter: function(t) {
var e = "";
return e += "" + c()(t[0].data[0]).format(a) + "
", e += '<table style="background-color: initial;">', [].forEach.call(t, function(t, i) {
e += "<tr>", e += '<td style="background-color: initial; border: none; padding-right: 3px;"><div style="width: 6px; height: 6px; border-radius: 100%; background-color: ' + t.color + ';"></div><td>', e += '<td style="background-color: initial; border: none; font-size: 12px;">' + t.seriesName + "</td>", e += '<td style="background-color: initial; border: none; color:' + t.color + '; padding-left: 7px;">' + (t.data[1] || "-") + "</td>", e += "</tr>"
}), e += "</table>"
}
},
toolbox: Object(l.f)(),
graphic: Object(l.d)(this),
legend: {
z: 1,
top: 347,
selected: this.chartSelectedObj,
data: n
},
grid: {
left: 55,
right: 20,
bottom: 80
},
xAxis: Object(l.i)({
minInterval: i,
axisPointer: {
show: !0,
label: {
backgroundColor: "rgba(0,0,0,0)",
formatter: function(i) {
var a = ["", i.seriesData[0].dataIndex, []],
o = (a[0], a[1]),
r = a[2];
e && (e[o] ? (r = t.echarts.convertToPixel("grid", i.seriesData[0].data), t.showVersion({
index: o,
data: e[o]
}, r)) : t.hideVersion())
}
}
}
}, {
xAxisFormat: o
}),
yAxis: Object(l.j)({
name: "\u6392\u540d",
nameLocation: "start",
inverse: !0,
min: 1,
max: function(t) {
return t.max < 5 ? 5 : t.max < 20 ? 20 : t.max < 50 ? 50 : t.max < 100 ? 100 : t.max < 500 ? 500 : t.max < 1e3 ? 1e3 : t.max < 1500 ? 1500 : t.max
}
}),
series: r
}), e) {
var b = [];
for (var m in e)
b.push({
index: m,
data: e[m]
});
var g = [];
s.a.util.map(b, function(e) {
var i = r[0].data[e.index],
a = t.echarts.convertToPixel("grid", i);
a[0] -= 5, a[1] = 0, g.push(Object(l.h)({
id: "version-icon-" + e.index,
position: a,
onmouseover: s.a.util.curry(t.showVersion, e, a),
onmouseout: s.a.util.curry(t.hideVersion, e, a)
}, {
staticURI: t.staticURI
}))
}), g = [{
type: "group",
id: "version-list",
$action: "replace",
bottom: 72,
z: 200,
children: g
}], this.echarts.setOption({
graphic: g
});
var x = this;
this.echarts.on("legendselectchanged", function(t) {
x.chartSelectedObj = t.selected;
var e = 0;
x.chartData.data.list.forEach(function(i, a) {
t.selected[i.name] && ePP
}), x.bightBtnCon = e ? "\u4e00\u952e\u9690\u85cf\u66f2\u7ebf" : "\u4e00\u952e\u663e\u793a\u66f2\u7ebf"
})
}
},

