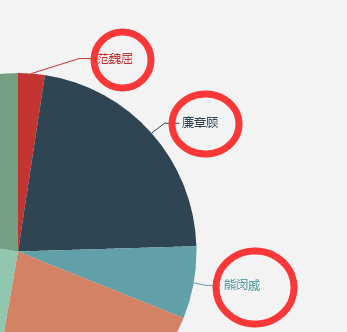
How does the echars pie chart bind click events to label?

see on the official website that components can be defined. I use

chart.on("click", "series.label", function () {...});

tried and it didn"t work. What is it caused by?

-- add rich

label: {

      show: true,
      rich: {
        til: {
          color: "-sharp000",
          fontSize: 14,
          align: "center",
          lineHeight: 21
        },
        desc: {
          color: "-sharp000",
          fontSize: 9,
          align: "center",
          lineHeight: 21
        },
        high: {
          color: "-sharpf8473d",
          fontSize: 9,
          align: "center",
          lineHeight: 21
        },
        middle: {
          color: "-sharpf9d03c",
          fontSize: 9,
          align: "center",
          lineHeight: 21
        },
        low: {
          color: "-sharp44d2ca",
          fontSize: 9,
          align: "center",
          lineHeight: 21
        }
      }
    },
Jun.18,2022

chart.on('click', function (params) {...} paramsdataTypeundefined
componentType:"series" -> seriesType: "pie" -> dataType: undefined

chart.on('click', 'series.pie.label', function () {...});
labelseriesTypedataType

give you a demo

<script type="text/javascript">
    var myChart = echarts.init(document.getElementById('main'));

    var option = {
        title: {
            text: '',
            subtext: '',
            x: 'center'
        },
        tooltip: {
            trigger: 'item',
            formatter: "{a} <br/>{b} : {c} ({d}%)"
        },
        legend: {
            orient: 'vertical',
            left: 'left',
            data: ['', '', '', '', '']
        },
        series: [
            {
                name: '',
                type: 'pie',
                radius: '55%',
                center: ['50%', '60%'],
                data: [
                    { value: 335, name: '' },
                    { value: 310, name: '' },
                    { value: 234, name: '' },
                    { value: 135, name: '' },
                    { value: 1548, name: '' }
                ],
                label: {
                    show: true
                },
                itemStyle: {
                    emphasis: {
                        shadowBlur: 10,
                        shadowOffsetX: 0,
                        shadowColor: 'rgba(0, 0, 0, 0.5)'
                    }
                }
            }
        ]
    };
    myChart.setOption(option);
    myChart.on('click', 'series.pie.label', function () {
        console.log('click');
    });
</script>
MySQL Query : SELECT * FROM `codeshelper`.`v9_news` WHERE status=99 AND catid='6' ORDER BY rand() LIMIT 5
MySQL Error : Disk full (/tmp/#sql-temptable-64f5-1e78227-453f8.MAI); waiting for someone to free some space... (errno: 28 "No space left on device")
MySQL Errno : 1021
Message : Disk full (/tmp/#sql-temptable-64f5-1e78227-453f8.MAI); waiting for someone to free some space... (errno: 28 "No space left on device")
Need Help?