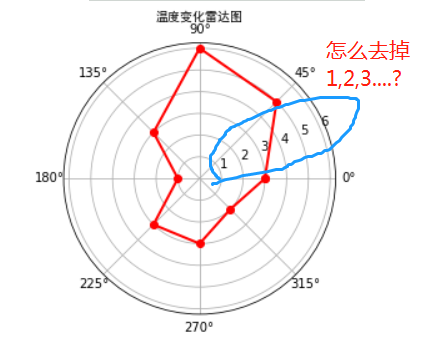
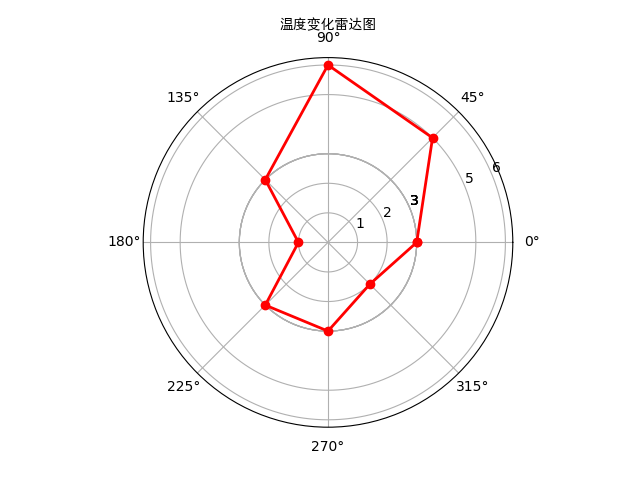
Why doesn't the python radar chart show the value of the coordinates?
import numpy as np
import matplotlib.pyplot as plt
-sharp
labels = np.array(["3","5","6","3","1","3","3","2"])
-sharp
dataLenth = 8
-sharp
data = np.array([3,5,6,3,1,3,3,2])

angles = np.linspace(0, 2*np.pi, dataLenth, endpoint=False)
data = np.concatenate((data, [data[0]]))
angles=np.concatenate((angles, [angles[0]]))

fig = plt.figure()
ax = fig.add_subplot(111, polar=True)
ax.plot(angles, data, "ro-", linewidth=2)
-sharpax.set_thetagrids(angles * 180/np.pi, labels, fontproperties="SimHei")
ax.set_title("", va="bottom", fontproperties="SimHei")
ax.grid(True)
plt.show()

import numpy as np
import matplotlib.pyplot as plt
-sharp
labels = np.array(['3','5','6','3','1','3','3','2'])
-sharp
dataLenth = 8
-sharp
data = np.array([3,5,6,3,1,3,3,2])

angles = np.linspace(0, 2*np.pi, dataLenth, endpoint=False)
data = np.concatenate((data, [data[0]]))
angles=np.concatenate((angles, [angles[0]]))

fig = plt.figure()
ax = fig.add_subplot(111, polar=True)
ax.plot(angles, data, 'ro-', linewidth=2)
-sharpax.set_thetagrids(angles * 180/np.pi, labels, fontproperties="SimHei")
ax.set_title("", va='bottom', fontproperties="SimHei")
ax.grid(True)
-sharp
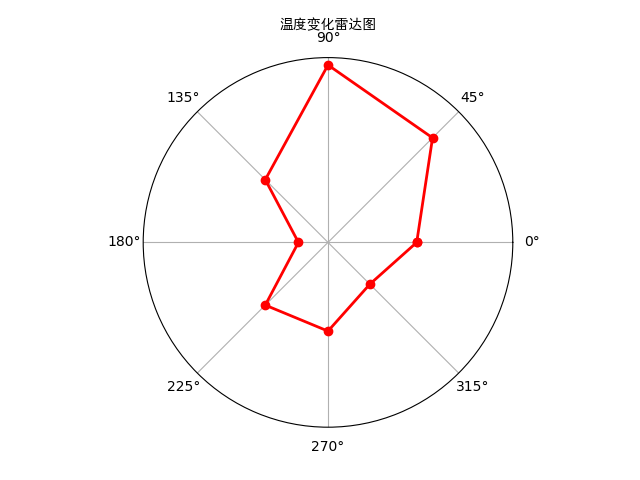
ax.tick_params('y', labelleft=False) -sharp lefttopbottomright
plt.show()
slightly embarrassed, can not completely help you, you can refer to, sorry!
< H2 > Plan 1 < / H2 >
import numpy as np
import matplotlib.pyplot as plt
-sharp
labels = np.array(['3','5','6','3','1','3','3','2'])
-sharp
dataLenth = 8
-sharp
data = np.array([3,5,6,3,1,3,3,2])

angles = np.linspace(0, 2*np.pi, dataLenth, endpoint=False)
data = np.concatenate((data, [data[0]]))
angles=np.concatenate((angles, [angles[0]]))

fig = plt.figure()
add:
after that
plt.yticks([])
or
ax.set_yticks([])

, ,
SO:()
ax.set_yticks(data,None)

Yes, the line 4 is gone. In other words, as long as there is a display.
all right. This is all I can do for you.
refer to the official API:
https://matplotlib.org/api/_a...
.


