myChart.showLoading ();
var symbolCenter= ["arrow", ""];
var symbolOuter= ["", "arrow"];
var webkitDep = {
"type": "force",
"categories": [//
    {
        "name": "",//
        "keyword": {},
        "base": ""
    }
],
"nodes": [//
    {
        "name": "",//
        "value": 3,
        "category": 0,//0

    },
    {
        "name": "",
        "value": 1,
        "category": 0
    },
    {
        "name": "",
        "value": 1,
        "category": 0
    },
    {
        "name": "",
        "value": 1,
        "category": 0
    },
    {
        "name": "",
        "value": 1,
        "category": 0
    }
],
"links": [//
    {
        "source": 0,//0
        "target": 1, //11
         //edgeSymbol: ["arrow", ""],
        "symbol": symbolCenter
    },
    {
        "source": 0,
        "target": 2,
        "symbol": symbolCenter
    },
    {
        "source": 0,
        "target": 3,
        "symbol": symbolOuter
    },
    {
        "source": 0,
        "target": 4,
        "symbol": symbolOuter
    }
]
};
myChart.hideLoading();

option = {
    legend: {
        data: [""]//name
    },
    series: [{
        type: "graph",
        layout: "force",
        animation: false,
        label: {
            normal: {
                show:true,
                position: "right"
            }
        },
        data: webkitDep.nodes.map(function (node, idx) {
            node.id = idx;
            node.symbol = "rect",
            node.symbolSize = [100,60]
            return node;
        }),
        markPoint:{
          symbolOffset:["-20%",0],
          symbolSize:60
        },
        categories: webkitDep.categories,
        force: {
            edgeLength: 300,//
            repulsion: 1000 //
        },
        edges: webkitDep.links
    }]
};
myChart.setOption(option);
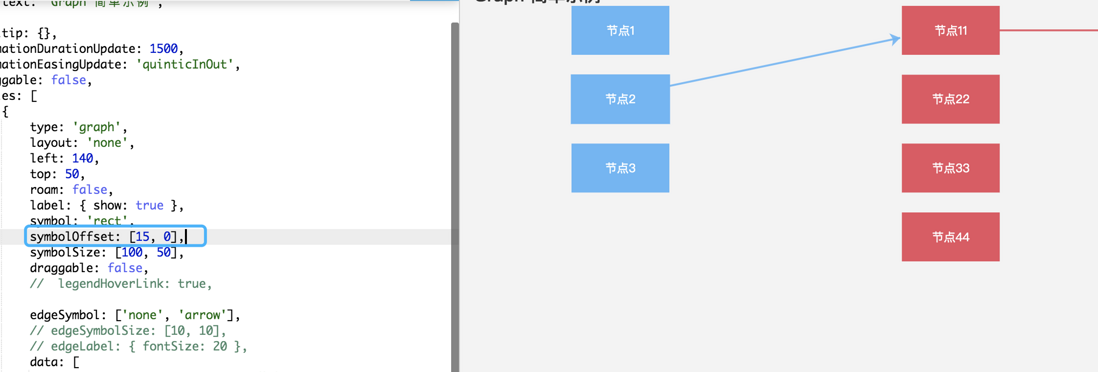
the above code can run directly on the echart official website.
four arrows are displayed only two arrows are displayed, and the other two are obscured.

