 series: [{
            name: "",
            data: this.temperatures,
            type: "spline",
            marker: {
                enabled: false,
                states: {
                    hover: {
                        enabled: true
                    }
                }
            },
            tooltip: {
                valueSuffix: "C"
            },
            zIndex: 1,
            color: "-sharpFF3333",
            negativeColor: "-sharp48AFE8"
        }, {
            name: "",
            data: this.windSpeeds,
            type: "spline",
            marker: {
                enabled: false,
                states: {
                    hover: {
                        enabled: true
                    }
                }
            },
            tooltip: {
                valueSuffix: "C"
            },
            zIndex: 1,
            color: "-sharpFF3333",
            negativeColor: "-sharp48AFE8"
        }
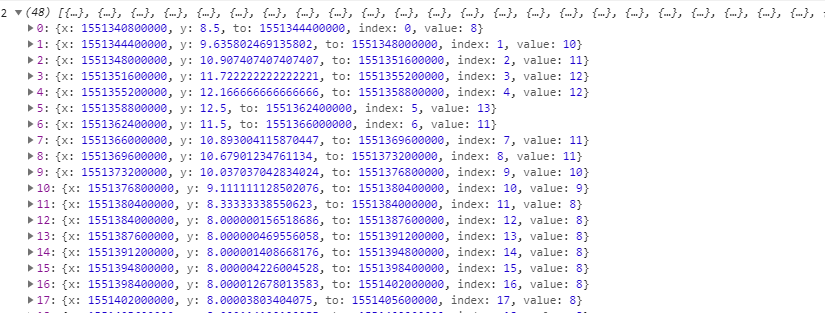
] code can be plotted normally, but the wind speed icon is added and the format of
this.temperatures is as follows:
this.windSpeed

is the data format of the two data incorrect or something wrong
is the data structure of the two arrays incorrect? Why is there no way to draw the curve of wind speed or because there is no interval on the Y axis?

