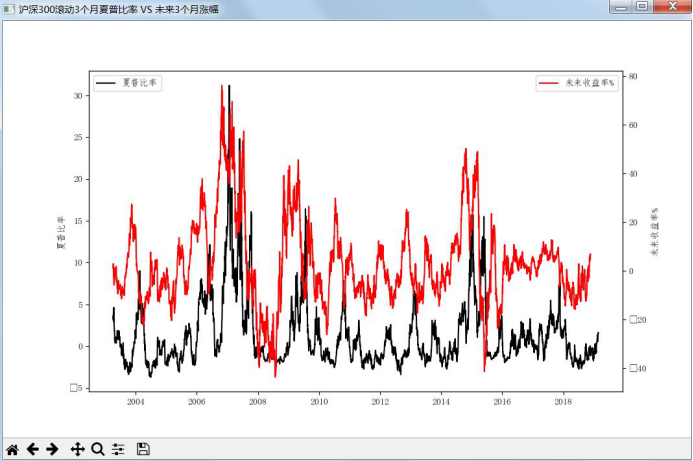
problem description
echarts displays different data on the left and right y axes, with normal values on the left and percentages on the right.

the environmental background of the problems and what methods you have tried
checked Baidu and echarts"s official website, but couldn"t find an accurate answer.
related codes
/ / Please paste the code text below (do not replace the code with pictures)
const echartBaseSetting = {
tooltip: {
trigger: "axis"},
legend: {
textStyle: {
  color: "-sharpccc"              // TODO: -sharpcccinactiveColor, theme
}
},
yAxis: {
type: "value",
axisLine: {
  lineStyle: {
    color: "-sharpccc"
  }
},
splitLine: {
  lineStyle: {
    color: "-sharpccc",
    type: "dashed"
  }
}
},
dataZoom: [{
type: "slider",
dataBackground: {
  lineStyle: {
    color: "-sharpccc"
  },
  areaStyle: {
    color: "-sharpe6f7ff"
  }
},
borderColor: "-sharpccc",
textStyle: {
  color: "-sharpccc"
},
handleIcon: "M10.7,11.9H9.3c-4.9,0.3-8.8,4.4-8.8,9.4c0,5,3.9,9.1,8.8,9.4h1.3c4.9-0.3,8.8-4.4,8.8-9.4C19.5,16.3,15.6,12.2,10.7,11.9z M13.3,24.4H6.7V23h6.6V24.4z M13.3,19.6H6.7v-1.4h6.6V19.6z",
handleSize: "80%"
}, {
type:"inside"}],
}
@ observer
class RollingSharpComponent extends React.Component {
store = new Store ();
/ *
- get icon configuration
* /
getChartSharpRatio = () = > {
const { chartData: { date, sharpe, fut_ret } } = this.store;//
return {
  ...echartBaseSetting,
  xAxis:{
    data: date,
    axisLine: {
      lineStyle: {
        color:"-sharpccc",
      }
    },
    splitLine: {
      show: false
    }
  },
  yAxis: [{
    name:"",
    type: "value",
    nameLocation:"center",
    axisLine: {
      lineStyle: {
        color: "-sharpccc",
      }
    },
    show:true,
    splitLine: {
      show: false,

    }
  },{
    name:"%",
    type: "value",
    nameLocation:"center",
    axisLine: {
      lineStyle: {
        color: "-sharpccc",
      }
    },
    splitLine:{
      show:false,
    }
  }],
  series: [{
    name: "",
    data: sharpe,
    type: "line",
    symbol: "none",
    symbolSize: 0,
    color:["red"]
  },{
    name: "",
    data:  fut_ret,
    type: "line",
    symbol:"none",
    symbolSize: 0,
    color:["-sharp000"]
  }]
}
};
/ *
- get icon configuration
* /
getChartDeviation = () = > {
const { chartData: { date, devt_std, fut_ret } } = this.store;

return {
  ...echartBaseSetting,
  xAxis: {
    data: date,

    axisLine: {
      lineStyle: {
        color: "-sharpccc",
      },
    },
    splitLine: {
      show: false,
    }
  },
  yAxis:[{
    name:"",
    type: "value",
    nameLocation:"center",
    axisLine: {
      lineStyle: {
        color: "-sharpccc",
      }
    },
    splitLine: {
      show: false,
    }
  },{
    name:"%",
    type: "value",
    position:"right",
    nameLocation:"center",
    axisLine: {
      lineStyle: {
        color: "-sharpccc",
      }
    },
    splitLine: {
      show: false,
    }
  }],
  series:[{
    name: "",
    data:devt_std,
    type: "line",
    symbol: "none",
    symbolSize: 0,
    color: ["red"]
  },{
    name: "",
    data: fut_ret,
    type: "line",
    symbol: "none",
    symbolSize:0,
    color: ["-sharp000"]
  }]
};
};
what result do you expect? What is the error message actually seen?
would like to see the big god solve the problem than attach the code.
